Example Signal Processing and Filter Design (Part 2)
Revelation of five vector operations
The calculation is simple and the geometric meaning is clear - the modular multiplication and the phase addition.
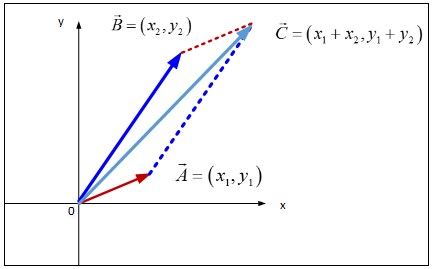
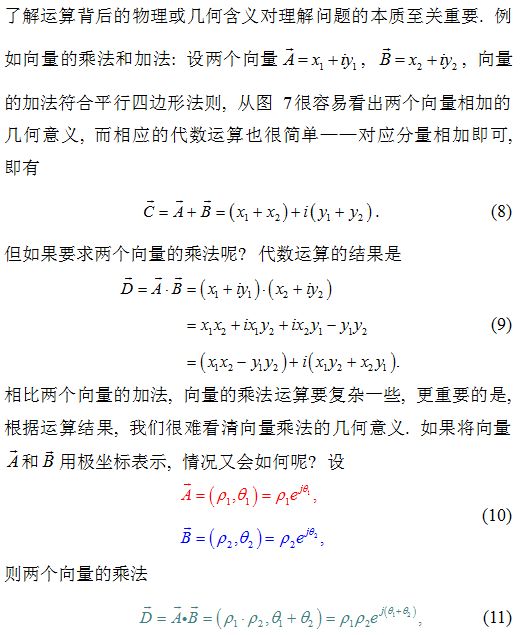
Figure 14 Cartesian Cartesian Coordinates
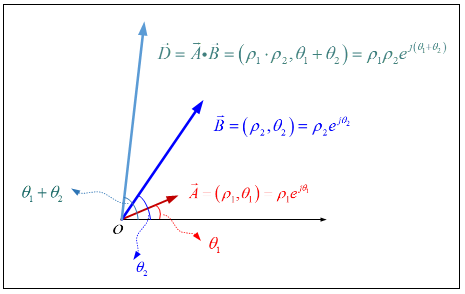
Figure 15 Polar Coordinates of Vector Multiplication
The example of vector operation tells us that choosing different coordinate systems not only affects the computational complexity, but also explains the geometric meaning of the calculations. The above example tells us that if the addition of vectors, the rectangular coordinate system is more convenient than the polar coordinate system; If it is a multiplication of vectors, it is obvious that the polar coordinate system is more convenient than the rectangular coordinate system.
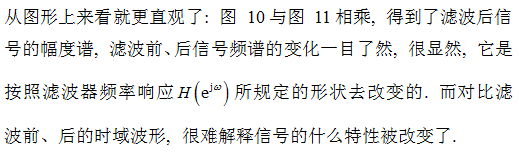
Going back to the topic of digital signal processing, convolution sums are a formula that puzzles countless people. However, it is also the source of classical digital signal processing algorithms. Since convolution sum operation is filtering, how can we judge the effect of filtering? How does it better understand the filtering behavior of the system?
The reason why the cries of the cry is so boring is because it contains a large number of high-frequency components. It seems that using the frequency parameter to explain the signal characteristics is very consistent with people's intuitive feeling. We have a better way to understand Is the physical meaning of the convolution sum possible? Can we explain the convolution sum from the perspective of the frequency domain? Of course, because we have the convolution theorem (nature):

Through the Fourier transform, the convolutions and operations in the time domain are replaced by the multiplication operations in the frequency domain. What are the benefits of multiplication in the frequency domain? Do not forget that we mainly aim at interpreting filters intuitively. The behavior and characteristics.
In the above discussion, we only focused on the amplitude spectrum. In practice, the phase spectrum must also be considered. The more complete expression is
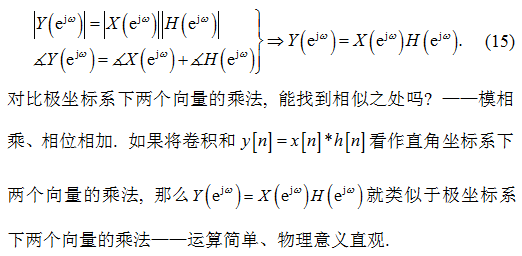
As an example of vector multiplication, we can see that the representation of vectors plays a key role; similarly, signals also have different ways of description, such as time domain, frequency domain, and complex frequency domain. Different representation methods are In order to make the analysis problem more simple, the physical meaning is more clear.
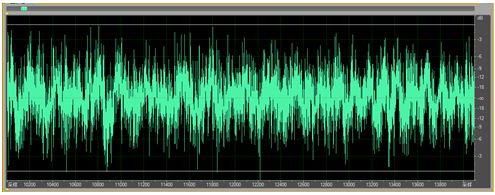
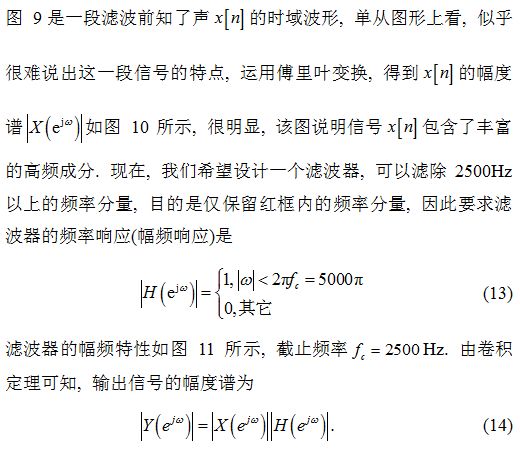
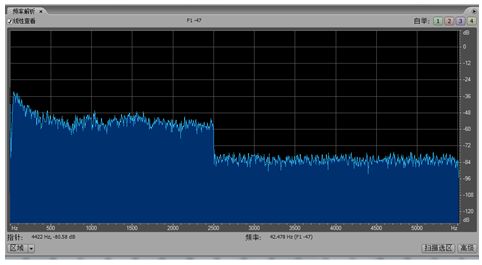
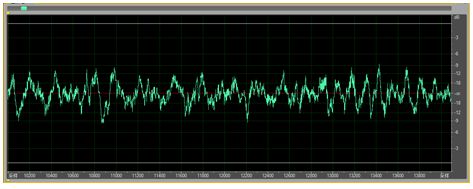
Figure 16 Knowing the time waveform of acoustic x[n] before filtering
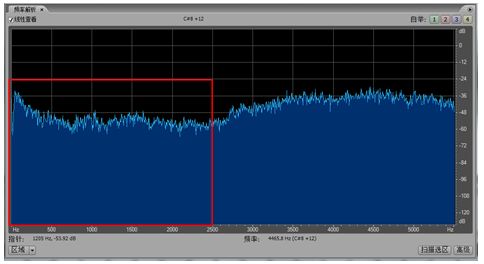

(The red box is the low-frequency component that you want to keep)


Six filter design journey
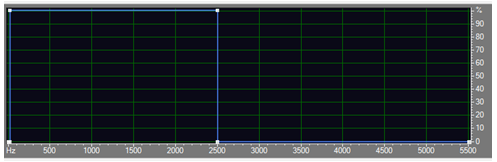
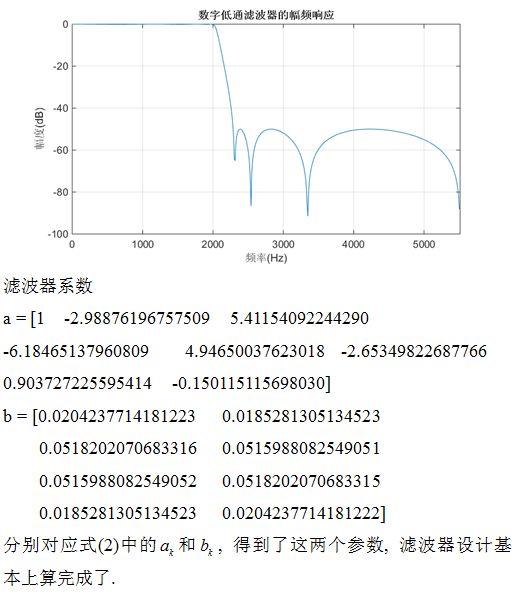
Figure 21 Digital Low Pass Filter Specifications

Clc;
Closeall
Fs = 11025; % sampling frequency (Hz)
Fp =2000; % passband cutoff frequency (Hz)
Fs =2500; % stopband cutoff frequency (Hz)
Ap =0.1; % passband attenuation (dB)
As =50; % stopband attenuation (dB)
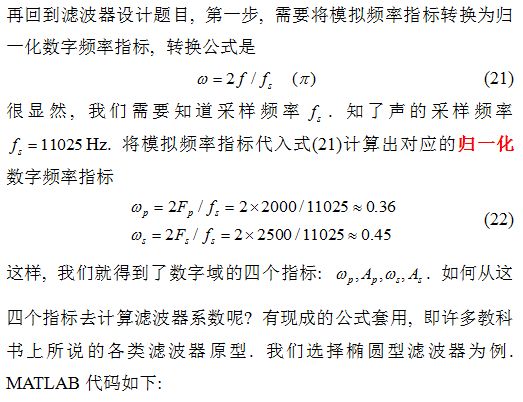
Wp = 2*Fp/fs; % normalized passband cutoff frequency
Ws = 2*Fs/fs; % Normalized Stopband Cutoff Frequency
[N, Wp] = ellipord(wp, ws, Ap, As); % Determines the order and cut-off frequency of the bandpass filter
[b, a]= ellip(N, ​​Ap, As, Wp); % Determine filter coefficients
[h, w] = freqz(b, a); % Find the frequency response of the digital band-pass filter
% The following is the draw command, draw the frequency response of the bandpass filter
Figure;
Plot (w*fs/(2*pi), 20*log10(abs(h)/max(abs(h))));
Axis([0,fs/2, -100,0]);
Title('Amplitude response of digital low-pass filter');
Xlabel('Frequency (Hz)');
Ylabel('Amplitude(dB)');
Grid
If you master the basic theory of filter design, but do not want to write code, you can use FDATool to easily complete the entire process of filter design.
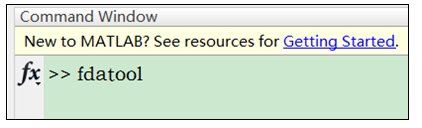
In the command window type: fdatool, Enter, you can see the interface shown in the figure below:
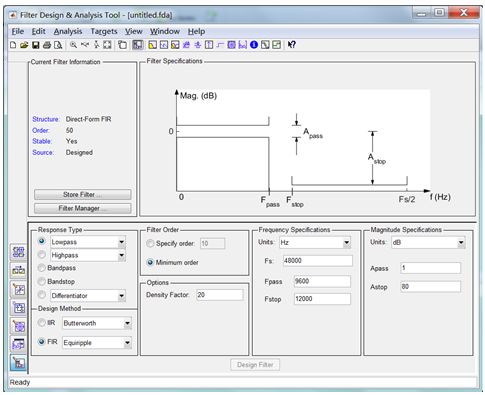
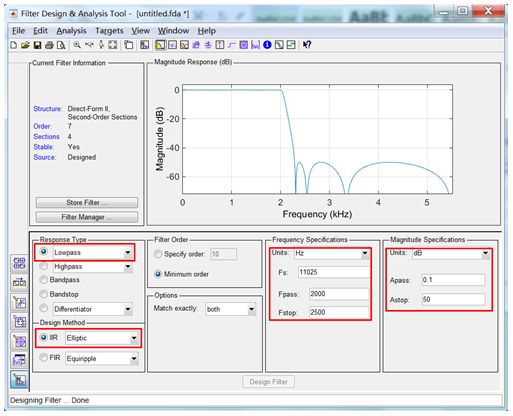
Then click the mouse to complete the filter design. For this example, we set the indicator as shown in the red box below. After completing the indicator setting, click the “Design Filter†button to complete the design. All about the filter Information can be obtained through menus or toolbars. Note the “CurrentFilter Information†section, which describes the basic filter information currently designed, including structure, order, stability, etc. There is a question worth considering: Filters What impact does the structure have on the engineering implementation of the filter? Cost, stability, and noise resistance are all related to the structure. Therefore, it is also important to understand the advantages and disadvantages of the filter's various structures.
Obviously, designing filters with FDATool is very simple! Regardless of the method used, don't forget the fundamental goal of filter design - get filter coefficients. For more on FDATool, click here and here.
After the filter design is completed, we should consider how to use the obtained coefficients to filter the input signal.
Car Phone Holder,Mobile Holder For Cars,Mobile Phone Holder For Dashboard,Mobile Phone Holder For Car Dashboard
Ningbo Luke Automotive Supplies Ltd. , https://www.nbluke.com